
Repository: Food system maps and illustrations
A brief overview of some possible food system maps / illustrations
K-HUB > Dig Deeper: Concepts > The food system concept > Food system maps and illustrations
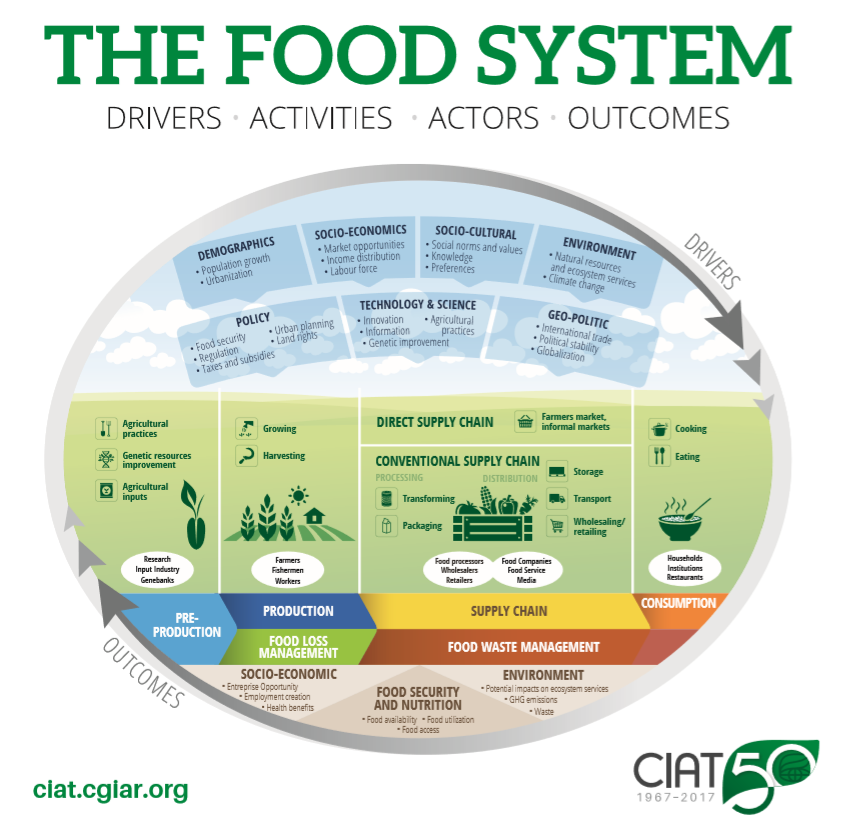
CIAT’s perspective on how the food system operates. Key drivers are in the top panel (blue), which influence activities from pre-production through to consumption and waste management (green) involving various actors (white bubbles). Together these have socio-economic; food security and nutrition; and environmental outcomes (brown), which in turn affect the human and environmental behaviour and their drivers.
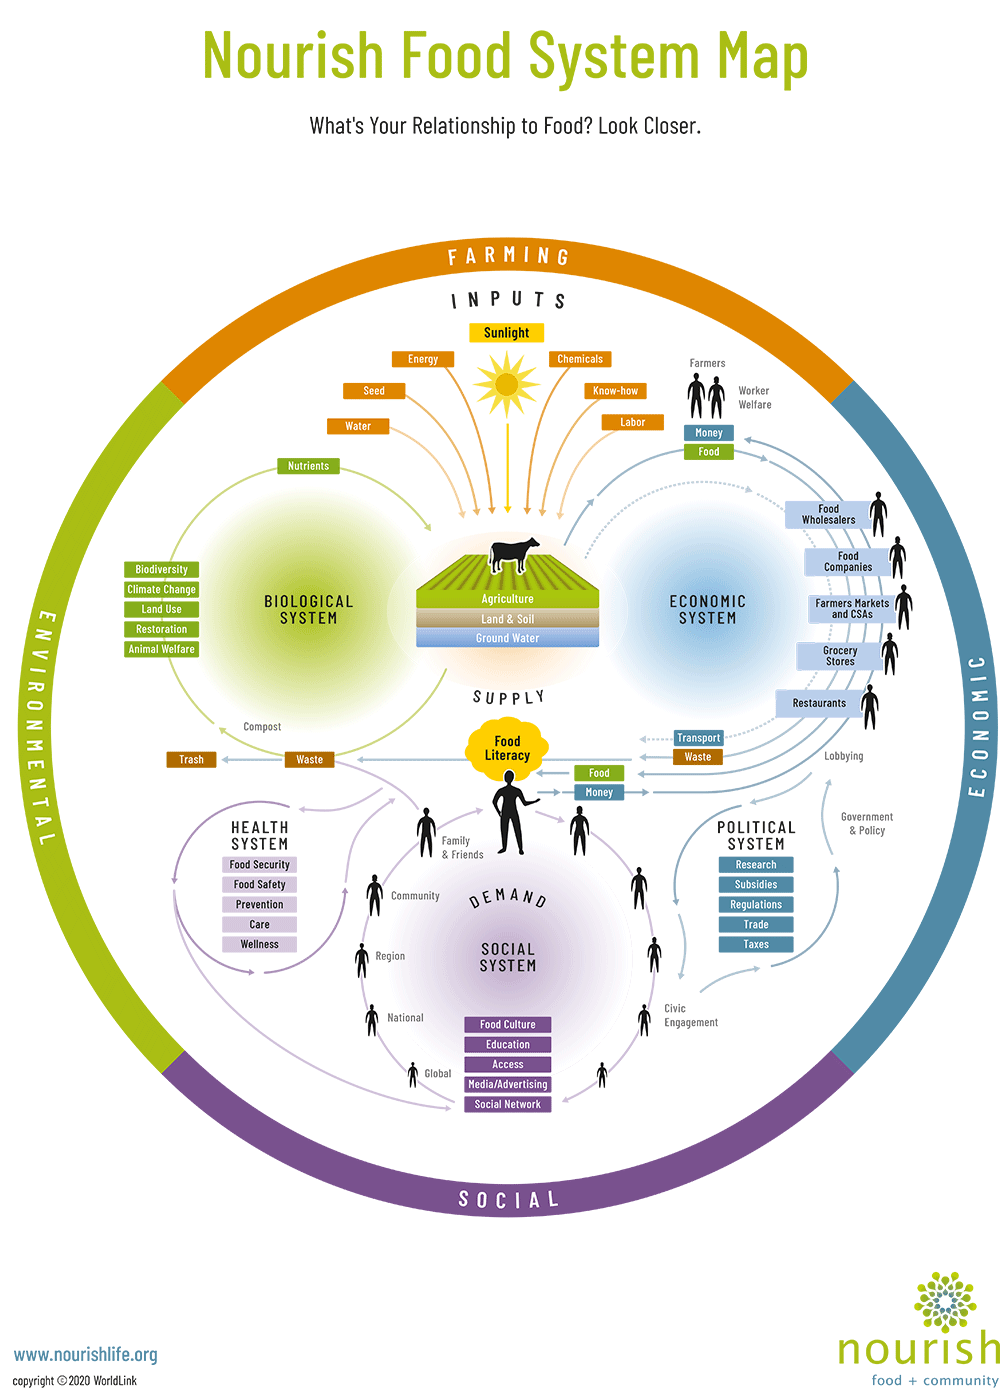
see: www.nourishlife.org/teach/food-system-tools/
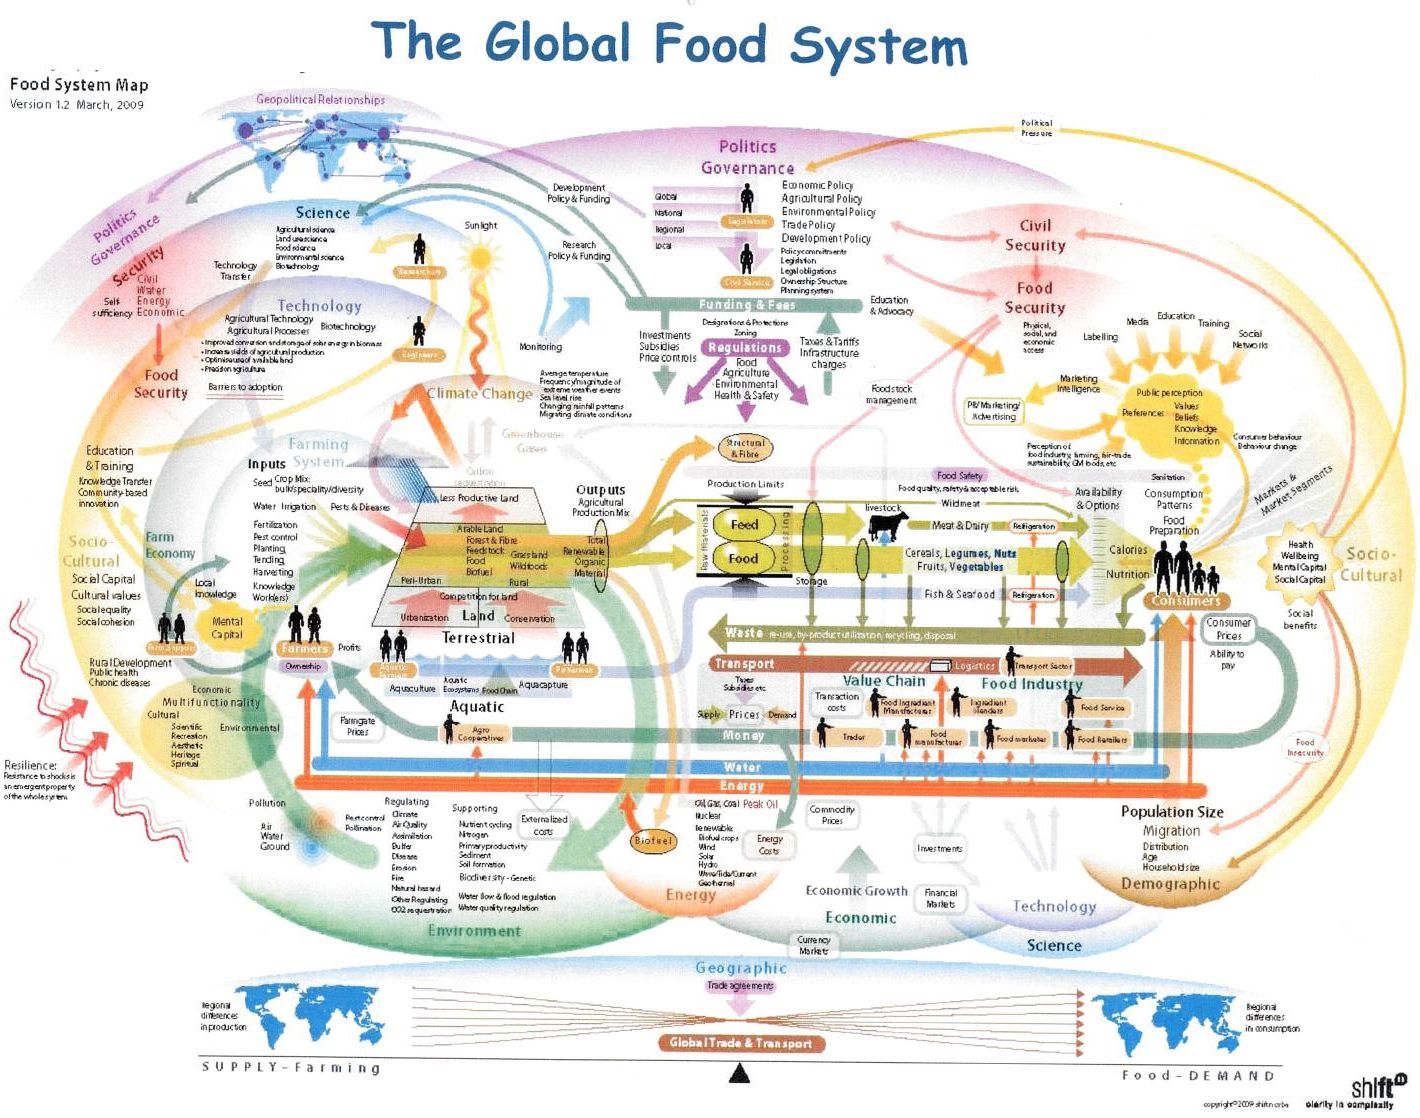
see: https://shiftn.com/
see: www.fao.org/3/ca2079en/CA2079EN.pdf
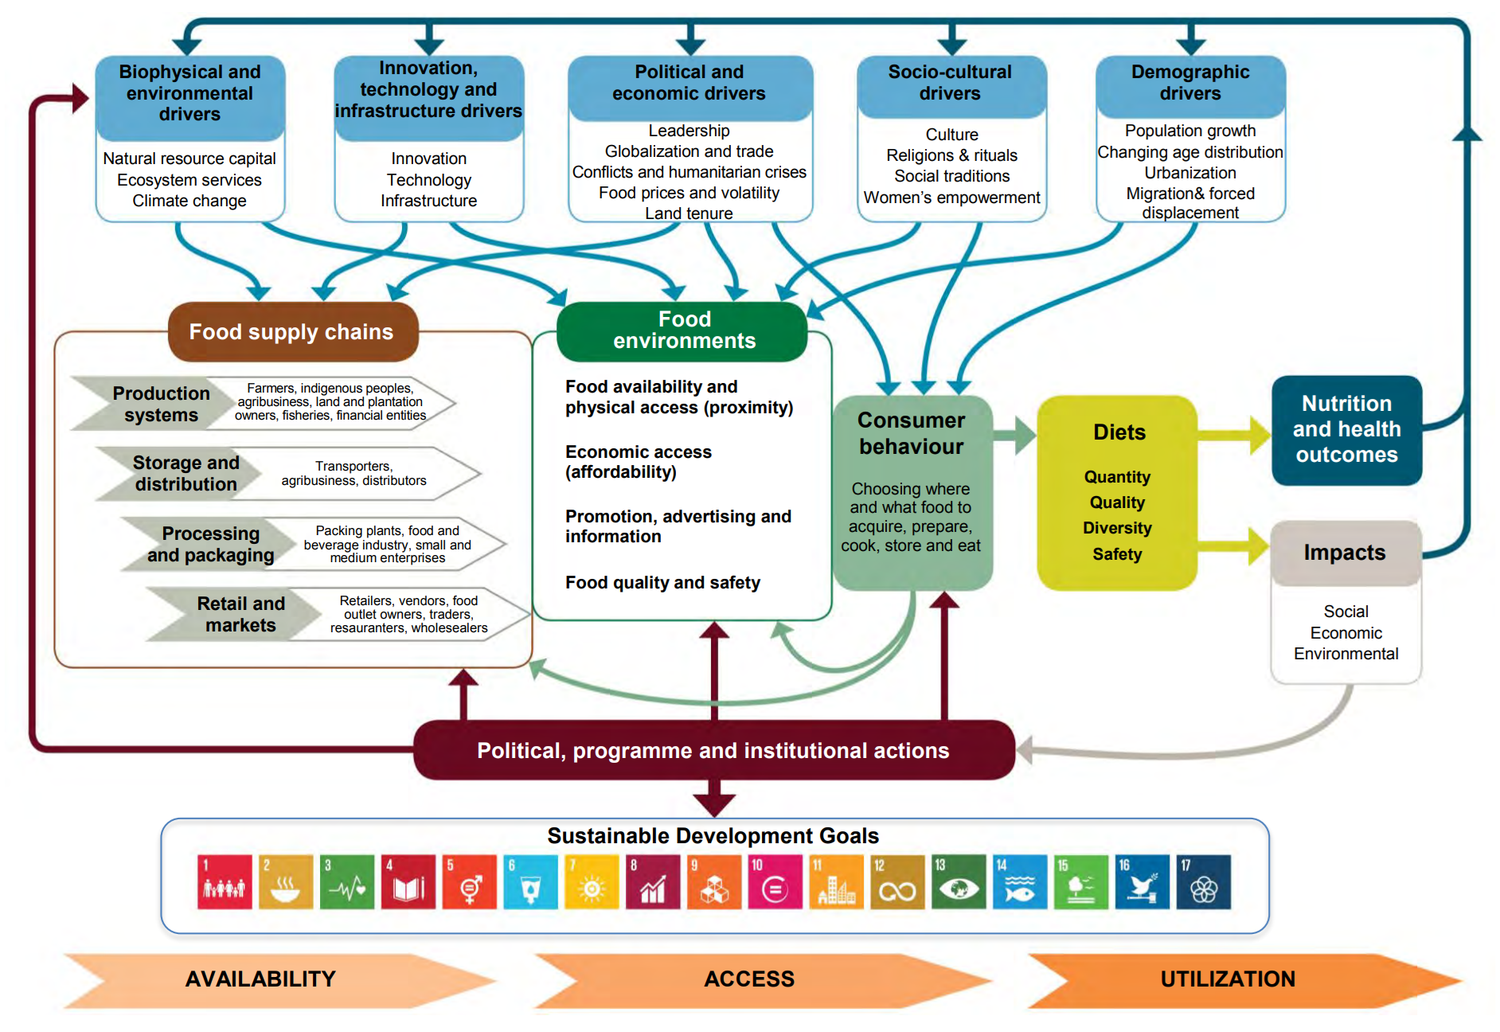
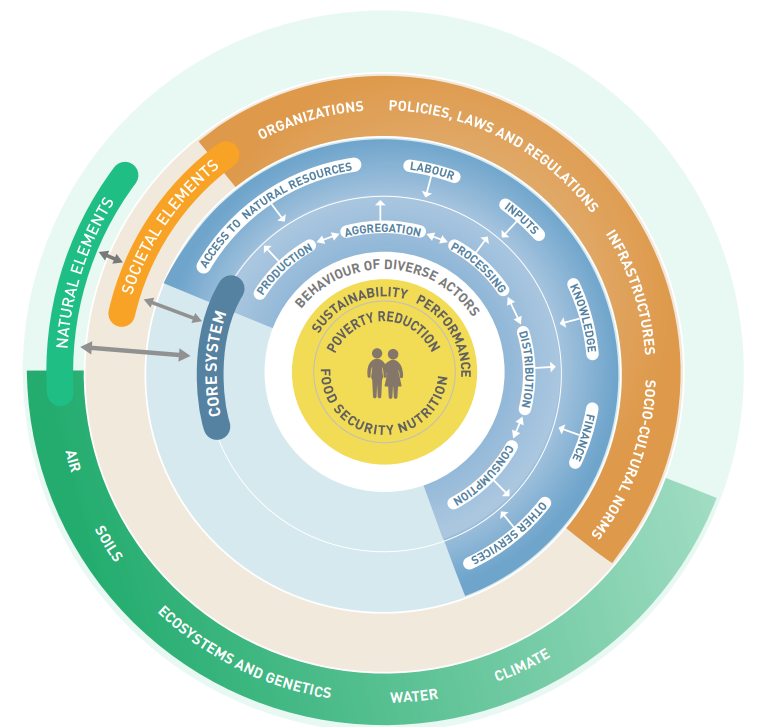
see: https://www.fao.org/3/i7846e/i7846e.pdf (HLPE Report Food Systems and Nutrition 2017)
K-HUB > Dig Deeper: Concepts > The food system concept > Food system maps and illustrations